
U.S. agricultural exports in the first four months (January – April) of 2021 were a record $59 billion, exceeding the previous record set in 2014 by nearly $5 billion. At the current pace, there is a strong possibility of a record-breaking year for U.S. agricultural exports surpassing the 2014 mark of $154.5 billion, according to the USDA’s International Agricultural Trade Report.
Robust global demand, high commodity prices, and increased U.S. competitiveness have led to record exports of corn, sorghum, beef, food preparations, and other products. Others, including soybeans, soybean meal, wheat, and dairy, have also seen large increases during recent years and have contributed significantly to early-year export levels.
The agriculture, food, and related industries are vital parts of the U.S. economy, contributing an estimated $1.109 trillion to the U.S. gross domestic product and providing employment for 22.2 million people in the United States in 2019, according to the USDA’s Economic Research Service.
Agricultural exports have grown significantly within the past decades, becoming an increasingly important component of the agriculture industry. From 2000 to 2020, U.S. agricultural exports grew from $56 billion to $150 billion.
It is estimated that U.S. agricultural exports supported nearly 1.1 million full-time jobs in 2019. In 2020, exports increased by nearly $9 billion during 2019. A record in 2021 would drive this total even higher, likely supporting more U.S. jobs and making a larger positive impact on the U.S. economy.
United States Agricultural Exports, Top Products (Value in Million USD)
| Product Group | 2016 | 2017 | 2018 | 2019 | 2020 | January – April 2020 | January – April 2021 |
|---|---|---|---|---|---|---|---|
| Soybeans | $22,839.2 | $21,456.3 | $17,058.0 | $18,663.0 | $25,683.2 | $4,665.3 | $8,432.3 |
| Corn | $9,878.6 | $9,130.6 | $12,462.1 | $7,651.1 | $9,210.4 | $2,922.6 | $7,577.9 |
| Tree Nuts | $7,902.3 | $8,479.4 | $8,515.5 | $9,075.7 | $8,401.5 | $2,904.4 | $2,823.8 |
| Pork & Products | $5,936.0 | $6,485.1 | $6,402.8 | $6,951.7 | $7,714.8 | $2,912.3 | $2,816.2 |
| Beef & Products | $6,360.3 | $7,262.7 | $8,356.6 | $8,094.5 | $7,649.0 | $2,656.7 | $2,932.8 |
| Dairy Products | $4,689.0 | $5,368.1 | $5,478.8 | $5,914.4 | $6,456.8 | $2,161.8 | $2,417.0 |
| Wheat | $5,346.3 | $6,058.3 | $5,387.4 | $6,232.0 | $6,297.8 | $1,998.2 | $2,363.2 |
| Cotton | $3,959.1 | $5,827.1 | $6,549.7 | $6,141.5 | $5,967.9 | $2,457.5 | $2,483.4 |
| Food Preparations | $4,451.4 | $4,301.2 | $4,598.9 | $5,030.3 | $5,082.2 | $1,676.1 | $1,824.7 |
| Soybean Meal | $4,073.3 | $3,880.8 | $5,072.6 | $4,365.5 | $4,758.5 | $1,586.4 | $2,238.2 |
| All Other | $63,467.5 | $64,616.3 | $64,818.7 | $63,063.0 | $62,813.9 | $21,031.7 | $23,306.2 |
| Total Exports | $138,903.0 | $142,865.8 | $144,701.0 | $141,182.7 | $150,036.1 | $46,973.0 | $59,215.7 |
An August 2020 World Trade Organization report examining the impact of COVID-19 on agricultural trade described the sector’s resilience as a whole. It highlighted the essential nature of food as the main factor. Coming out of a strong year in 2020, the United States appears well-positioned for an even stronger 2021, stated the report.
U.S. agricultural exports during the pandemic reinforce this idea. While the export value of a few products like tree nuts, beef, and cotton declined in 2020, total exports increased significantly. Record harvests causing low prices were the main drivers for the decline in tree nut export value (despite volume increases). Still, declines in beef and cotton could be partially attributed to COVID-19 due to reduced hotel, restaurant, and institutional sector demand and a slowdown of global apparel consumption.
All other top export products performed as well as or better than 2019. In the first four months of 2021, exports of top products have met, exceeded, or in some cases greatly exceeded exports from the same period in 2020, contributing to an overall increase of more than $12 billion.
Related Article: U.S. Agricultural Groups Call for Review Over Trade Relations with Mexico
According to the USDA, many upward trends from 2020 have continued into the new year. Global demand is rising, driven in part due to record purchases by China as it rebuilds its swine herd from African Swine Fever and demand for animal feed surges. The early 2020 signing of the Phase One agreement between the United States and China created a pathway for U.S. producers to step in and fill both the demand for pork, beef, and poultry products as well as the rising demand for animal feed.
Production shortfalls reduced competition from feed exporters in South America, which also had an important effect on trade in the early months of 2021. The combination of increased global demand and reduced supply has led to price increases in the past year that benefit U.S. exporters.
Two additional major trade agreements were also implemented in 2020. The U.S.-Japan Trade Agreement entered into force at the beginning of the year, providing tariff reductions for a wide range of agricultural products, including beef, pork, and dairy, and preferential market access provisions for others, including wheat and wheat products. While tariffs on many products were eliminated immediately, others will be gradually reduced in the coming years.
The U.S.-Mexico-Canada Agreement (USMCA) entered into force in mid-2020, containing provisions to expand market access for U.S. exporters of dairy, poultry, eggs, and others while strengthening science-based trade rules and other processes.
These agreements and the Phase One agreement with China facilitate trade with four of the United States’ top trading partners. They will have lasting positive benefits for agricultural producers in 2021 and beyond.
Excellent agricultural export performance to date is not limited to bulk and meat products. For the period from January to April, 16 product groups reached record export levels in 2021:
January – April 2021 United States Agricultural Export Records (Value in Million USD)
| Product Group | January – April 2021 Export Value | Year of Previous Record | Previous Record Value | % over Previous Record |
|---|---|---|---|---|
| Corn | $7,577.9 | 2008 | $4,949.4 | 53% |
| Beef & Beef Products | $2,932.8 | 2020 | $2,656.7 | 10% |
| Food Preparations | $1,824.7 | 2019 | $1,699.7 | 7% |
| Other Feeds, Meals & Fodders | $1,173.2 | 2014 | $1,161.0 | 1% |
| Sorghum | $963.0 | 2015 | $892.5 | 8% |
| Essential Oils | $856.1 | 2018 | $724.0 | 18% |
| Non-Alcoholic Bev. (ex. juices) | $824.4 | 2014 | $817.7 | 1% |
| Dextrins, Peptones, & Proteins | $666.8 | 2020 | $599.8 | 11% |
| Condiments & Sauces | $652.7 | 2019 | $601.8 | 8% |
| Dog & Cat Food | $646.0 | 2020 | $548.7 | 18% |
| Chocolate & Cocoa Products | $553.1 | 2015 | $534.5 | 3% |
| Hay | $482.3 | 2020 | $474.8 | 2% |
| Live Animals | $366.3 | 2019 | $287.4 | 27% |
| Beer | $246.4 | 2018 | $218.1 | 13% |
| Eggs & Products | $238.3 | 2015 | $223.9 | 6% |
| Nursery Products & Cut Flowers | $179.2 | 2018 | $167.0 | 7% |
U.S. processed product exports are strongly represented on the list of high performers in early 2021. Food preparations, the largest processed product group that contains various ingredients for food manufacturing and some consumer-ready packaged and canned foods, had a notable increase of $125 million above the previous January – April record set in 2019.
Other processed product groups like condiments & sauces, dog & cat food, and beer have also been high performers. The strongest markets for U.S. processed products are USMCA partners Canada and Mexico, but other markets have been growing in recent years.
Countries with rapidly increasing numbers of middle-class households tend to show the most consumption growth for these products.
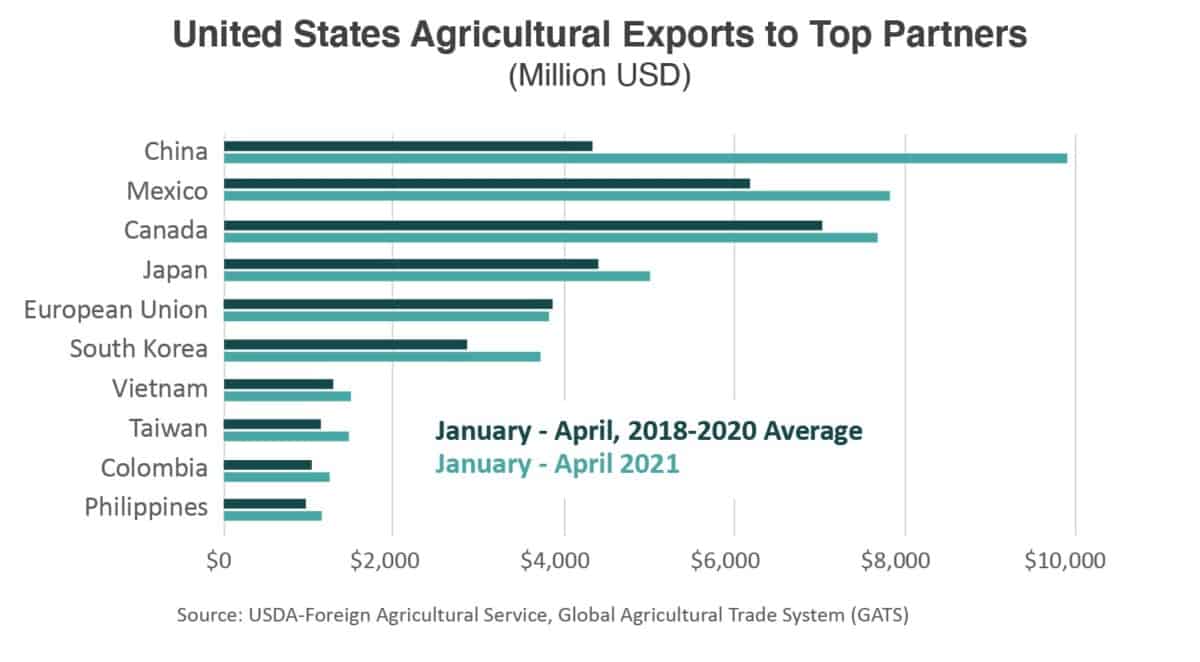
The report underscored that another important achievement is that exports so far this year have increased in all product groups and almost all major U.S. partners.
For each of the top 10 markets for U.S. products in 2020 (China, Canada, Mexico, Japan, the European Union, South Korea, Vietnam, Taiwan, the Philippines, Colombia), total exports are higher in January – April 2021 compared to the same period in 2020. For 9 of these 10 markets (excluding the European Union), this sets a 4-month export record.
This diversity of potential markets is a source of strength and stability and is an indicator of high overall competitiveness of U.S. products in 2021. This performance is reinforced by trade agreements with many of these top partners, including the recent agreements with Canada, Mexico, Japan, and China, as well as with South Korea and Colombia.
Based on current performance, the USDA said, U.S. producers should look forward to a bright 2021 for agricultural exports. Global demand is high, and consumption habits for products that were affected by COVID-19 will continue to normalize.
If U.S. agricultural exports continue to be as competitive as they have been in the early months of the year, 2021 has a great chance at becoming a record year, paving the way for more records to come.
As income worldwide increases and more customers emerge, U.S. farmers, ranchers, and those employed in the industries driving agricultural trade should expect a large part of global demand to be met by the United States, fulfilling its role as one of the world’s largest suppliers of food and agricultural products.