
The online grocery market was down 1.2% in January compared to last year due to a substantial decline in consumers’ use of home delivery services.
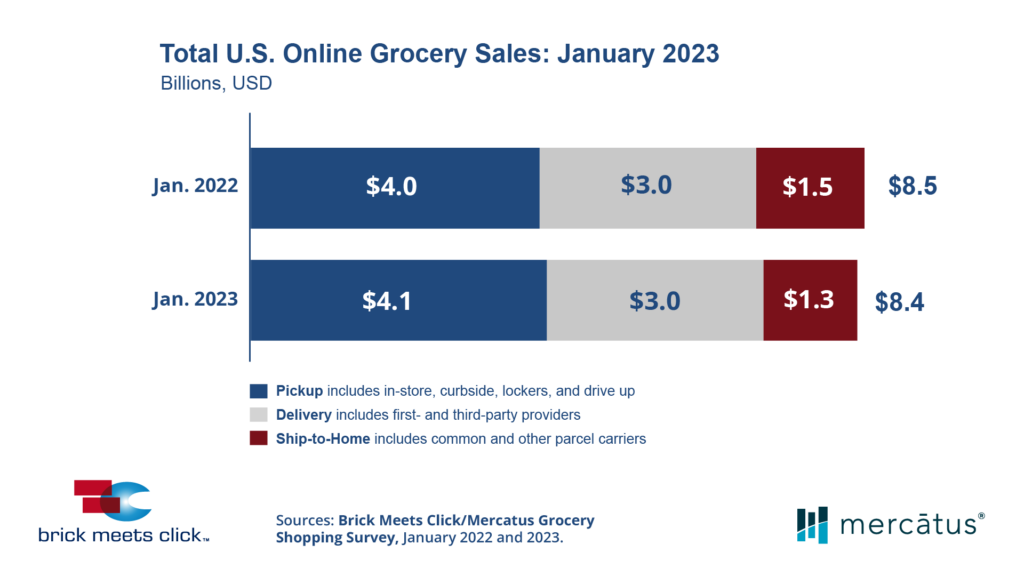
According to the monthly Brick Meets Click/Mercatus Grocery Shopping Survey, January closed with $8.4 billion in total online sales. This drop in total online grocery sales resulted from a 15% decline in Ship-to-Home sales, totaling $1.3 billion.
Meanwhile, Pickup posted the strongest gains, increasing almost 3% on a year-over-year basis to 4.1 billion. In comparison, Delivery grew less than 1%, holding steady at around $3.0 billion.
Collectively, the three segments captured just over 12% of total grocery spending in the month, slightly higher than a year ago and likely buoyed by strong overall grocery spending by U.S. households. Excluding Ship-to-Home, the share of spending attributed to Pickup and Delivery was more than 10%.
Insights from the online grocery market January 2023 results focus on year-over-year shifts in household usage, order activity, spending patterns, and causal factors such as intent to repeat and health concerns.
Related Article: December U.S. Online Grocery Sales Reach $9.1 Billion
HOUSEHOLD USAGE
The total overall online grocery market user base for January dropped 1.6% versus last year. Pickup was the only receiving method that expanded its respective monthly active user (MAU) base during January, although it was up only by 1%. In contrast, the MAU base for Delivery dipped by 2%, and Ship-to-Home plummeted by 10% compared to the prior year.
The pullback in total MAUs was driven mostly by the largest user group (30–44-year-olds), which shrank 5% from the prior year, but a 4% decline in the 60-and-over age group also contributed.
Much like in past months, the demand for Mass is strong. Mass saw a surge of more than 20% in MAUs during January versus last year, while the Grocery MAU shrank by 6%, likely due to economic conditions and the relative price gap between Grocery and Mass.
Meanwhile, cross-format shopping between Grocery and Mass remained close to 30% for the month. It was up slightly versus a year ago, highlighting how 3 in 10 households who shop with a Grocery retailer online also bought groceries online from a Mass retailer.
ORDER ACTIVITY
Overall, MAUs placed fewer online orders for groceries during the month, continuing a longer-term, downward trend since this measure peaked in May 2020. The decline in ordering frequency was driven by a combination of fewer MAUs making at least three orders during the month and an increase in the number of households completing only one order.
Order frequency trends varied between MAUs of Mass and Grocery year over year. Mass saw order activity from its MAU base grow 4% versus last year, while Grocery experienced order frequency growth of less than 1%.
SPENDING PATTERNS
The average order value (AOV), which excludes the costs of using the service (charges, fees, tips), was mixed across the three receiving methods.
Ship-to-Home experienced a drop in AOV of over 5% versus last year as monthly active users continued to adjust this segment’s role for receiving various types of grocery products. In contrast, Delivery and Pickup reported gains of 6% and 8%, respectively, over the same period.
Spending trends across the Pickup and Delivery formats were generally positive, although Grocery’s increase was less than half of the 11% gain that Mass reported. Conversely, Ship-to-Home formats reported pullbacks in spending per order, including Amazon’s pure-play services, whose AOV fell by 4%.
CAUSAL FACTORS
For January, the likelihood that a customer will use the same service within the next 30 days dipped approximately two percentage points versus last year to 60%. The decline in repeat intent was largely driven by the more frequent customers, which is troubling because they spend considerably more per order than the customer segments who buy less often.
Comparing the repeat intent rates of Grocery and Mass, Grocery trailed Mass by over 14 percentage points in January, the largest gap since measurement started. The Grocery repeat intent rate now hovers just above 50%.
“This large gap in repeat intent is concerning and should raise a red flag for conventional grocers,” said David Bishop, Partner of Brick Meets Click. “While our monthly research didn’t examine the causes for the variations between Grocery and Mass, it could be associated with a number of variables, including product pricing, service-related costs, or differences in customer experience, so grocers may want to analyze what are the main culprits driving their respective rates lower.”
When it comes to health concerns, it’s no longer just about COVID, as the flu and RSV are now also triggering worries for customers. The research estimated that roughly 7% of the combined Pickup and Delivery MAUs for January 2023 were motivated in part by these concerns.
“Grocers would benefit from focusing on initiatives aimed at driving repeat engagement and loyalty to grow share of wallet with existing customers,” said Sylvain Perrier, president and CEO of Mercatus. “Customers now expect retailers to engage them based on their individual preferences and purchase patterns. A retailer’s first-party data is a great starting point to segment customers and develop a more personalized experience.”